Graphic design and typesetting service
Infographics
Infographics are becoming increasingly popular, because they provide an easy way to show complex information in an at-a-glance format, and they’re particularly good at showing complex relationships between apparently disparate elements. These days they’re often a page of facts and figures, but in one form or another information graphics have been around for years, as charts, graphs and tables.
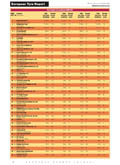
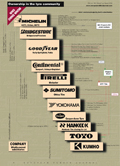
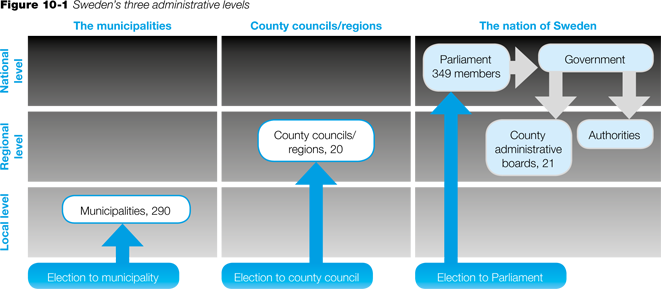
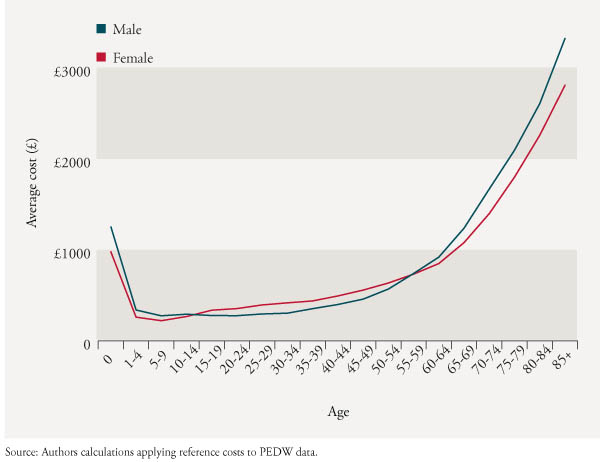
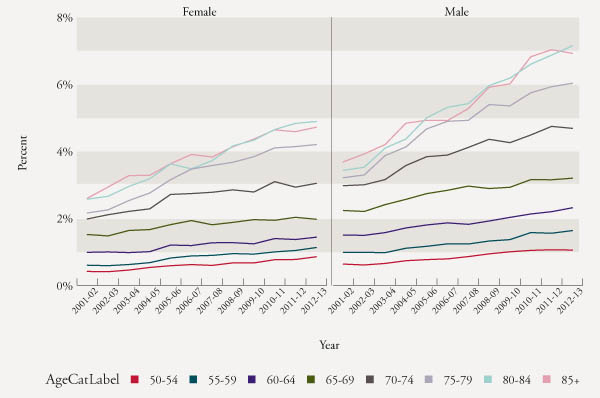
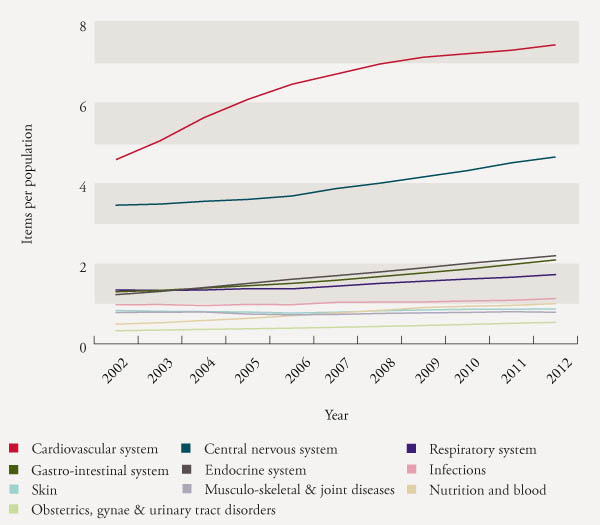
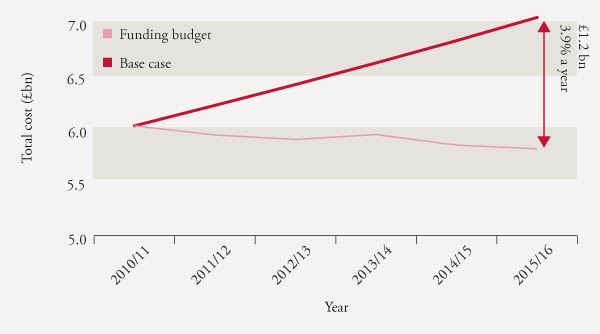
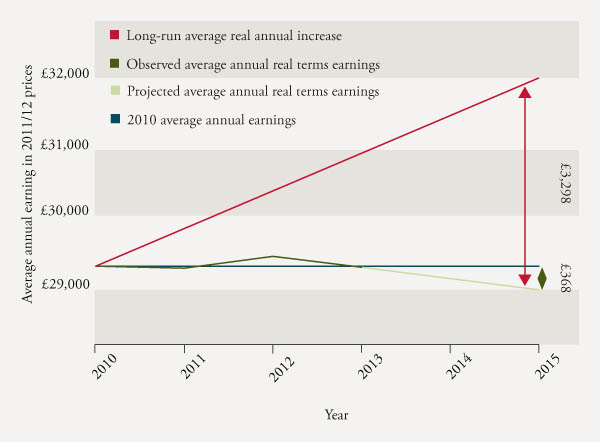
This page shows a few examples of information graphics created by Medievalbookshop — click on the thumbnails to look at larger versions of the images.
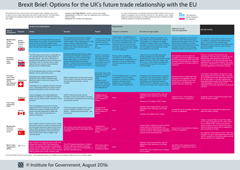
Chart to illustrate Brexit options
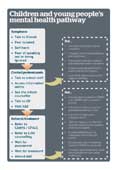
Graphics for health industry brochure
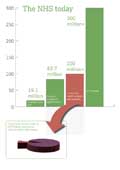
Scamp graphic for proposal document
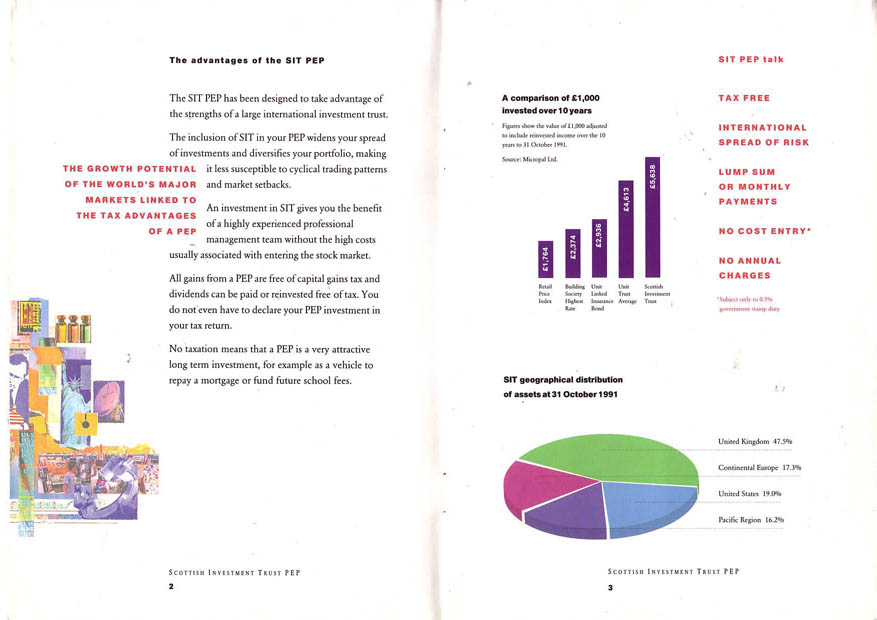
Investment brochure
Charts & tables for magazine
Organisation charts for an online journal
Graphs for corporate brochure
Website written, coded and designed by Medievalbookshop

